


Why Choose AIMS Industrial?
We understand the demands of Australian manufacturing and maintenance.
Reliable Industrial Products
Trusted brands and quality products that meet Australian industrial standards
Fast Delivery Across Australia
Quick dispatch from our warehouses to manufacturing sites nationwide
Expert Product Advice
Knowledgeable team ready to help you find the right solution
Trusted by Manufacturing Teams
Servicing industrial facilities across Australia for over 30 years


Our Top Brands


Techtop 415 V Three Phase Aluminium Motor (TAI)
Choose your option


Techtop 240 V Aluminium Motor (TMY)
Choose your option


Techtop Aluminium Motor (TML)
Choose your option


Techtop 415V Three Phase Cast Iron Motor (TCI)
Choose your option


Macnaught Grease Fitting Unblocker GFU
Choose your option


Macnaught Replacement Fuel Filter - Strainer Element Kit
Choose your option


Macnaught Fuel Filter Assembly
Choose your option

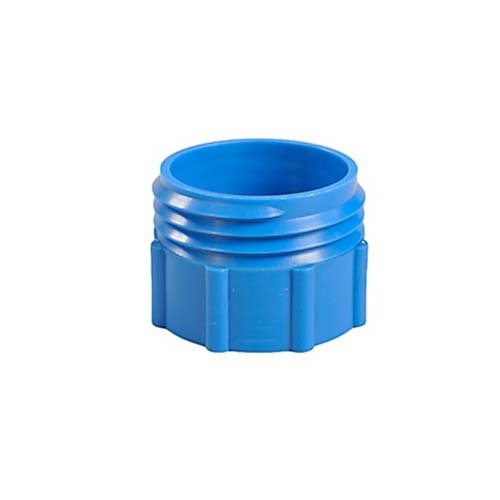
Macnaught Bung Adaptor 2" BSP
Choose your option


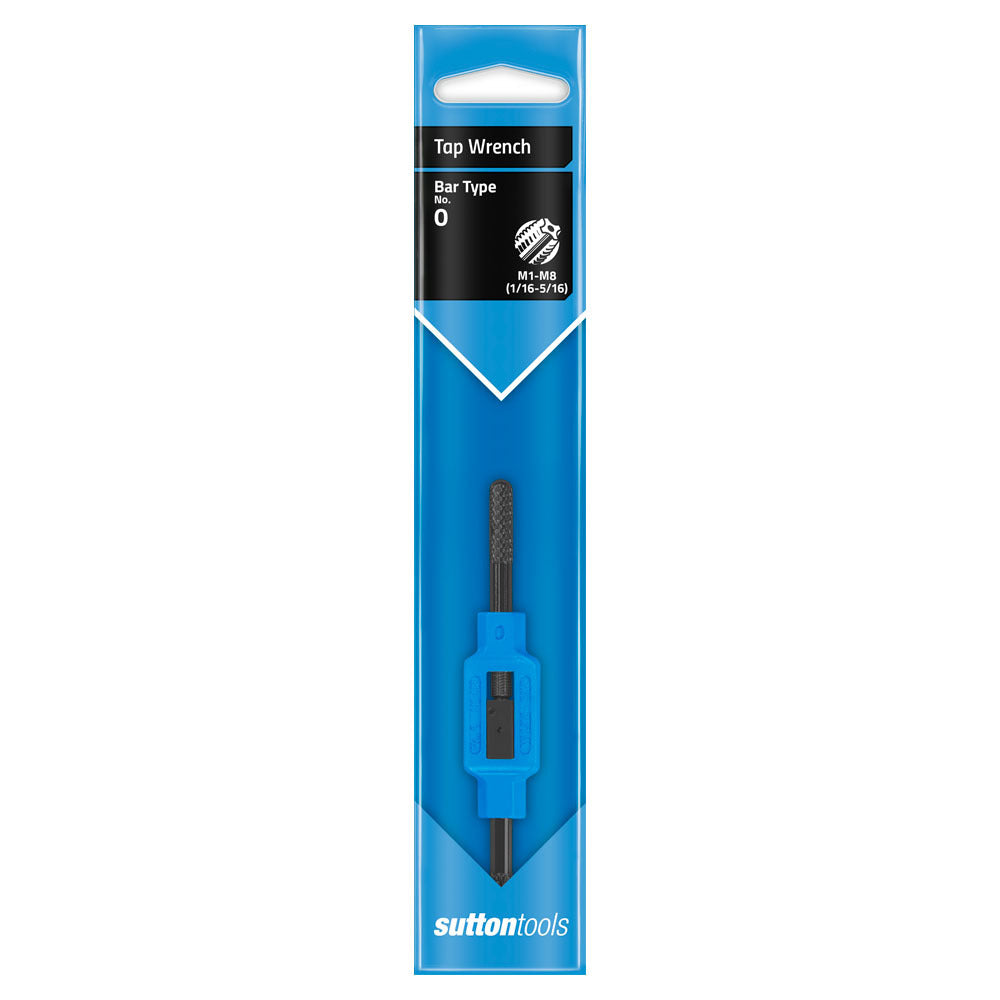
Sutton Tools Adjustable Tap Wrench Bar Type - Tool Steel
Choose your option
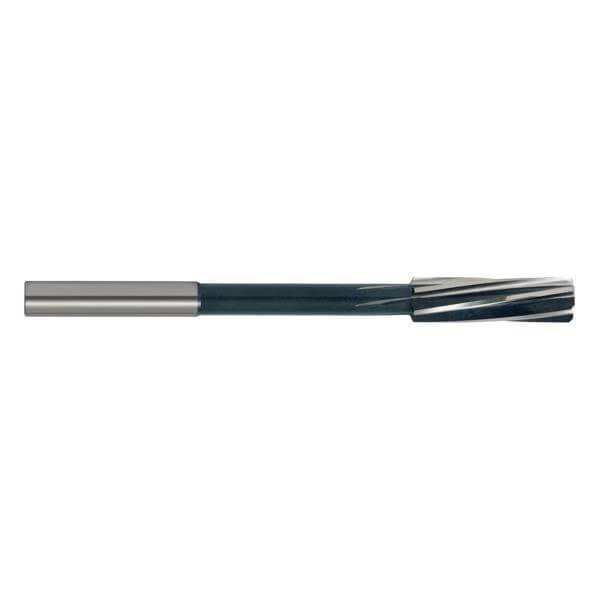
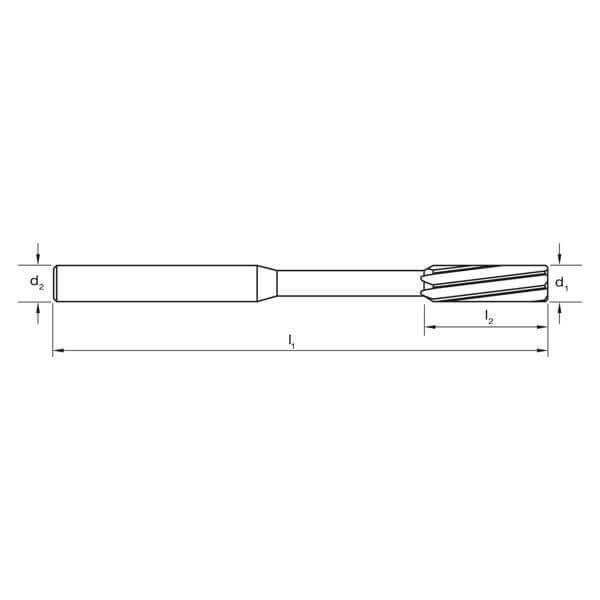
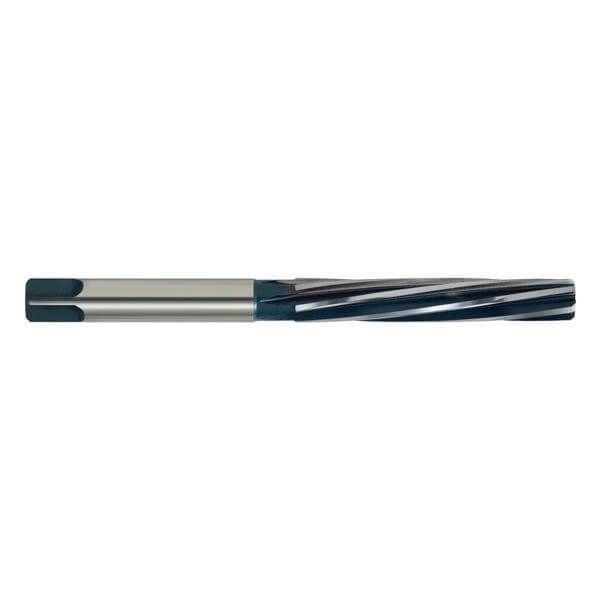
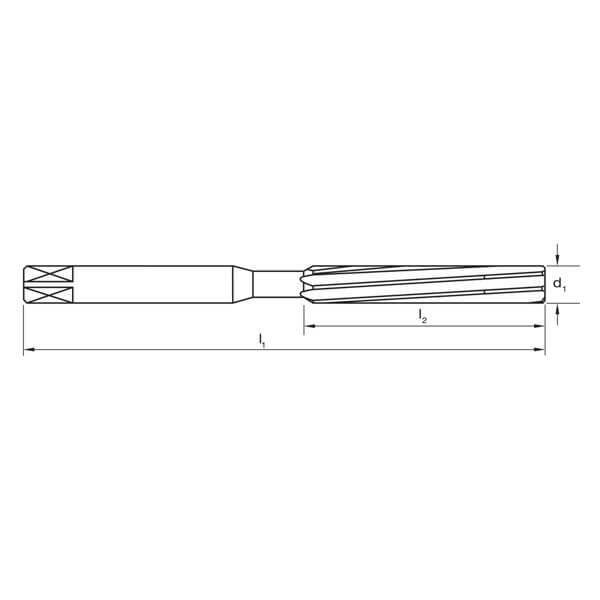
Sutton Tools R102 Chucking Reamer DIN212 - Cobalt Steel
Choose your option
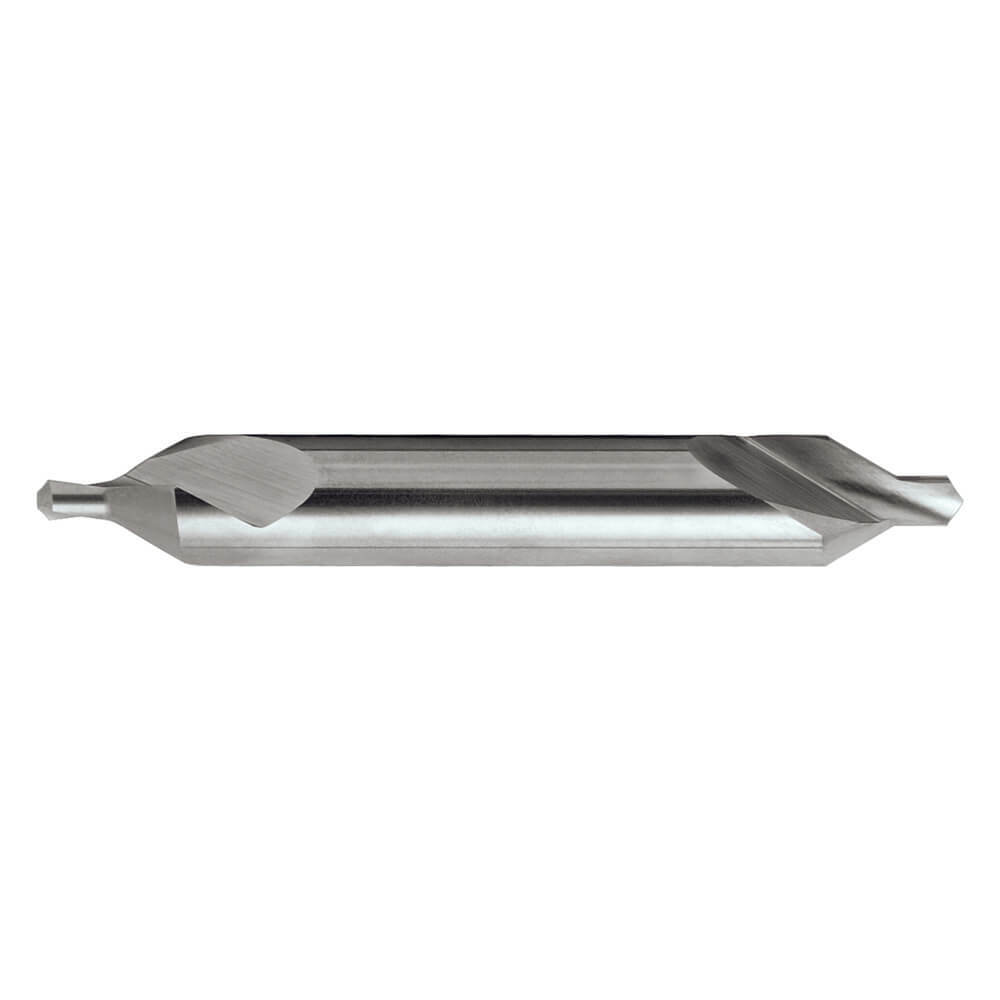
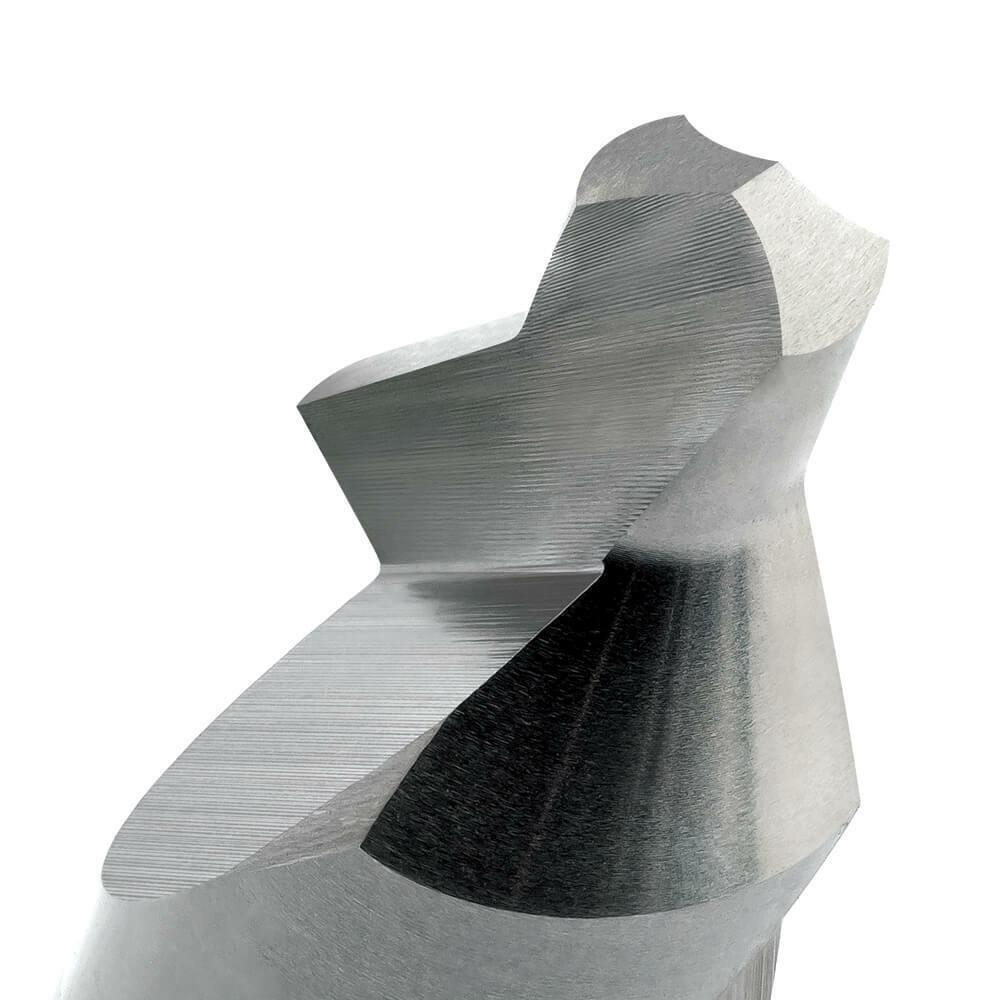
Sutton Tools D136 60° Centre Drill Bit - Plain Type - ANSI B94-11 HSS
Choose your option
Sutton Tools R100 Hand Reamer DIN206 - High Speed Steel HSS
Choose your option


Gates Truflex Light Duty V Belt - 3L Section
Choose your option

Gates 15Kg (7401-0076) Tension Tester - 1 Barrel
Choose your option


Gates Tri-Power Notched (Cogged) Classical Section Belt - BX Section
Choose your option


Gates Tri-Power Notched (Cogged) Classical Section Belt - AX Section
Choose your option

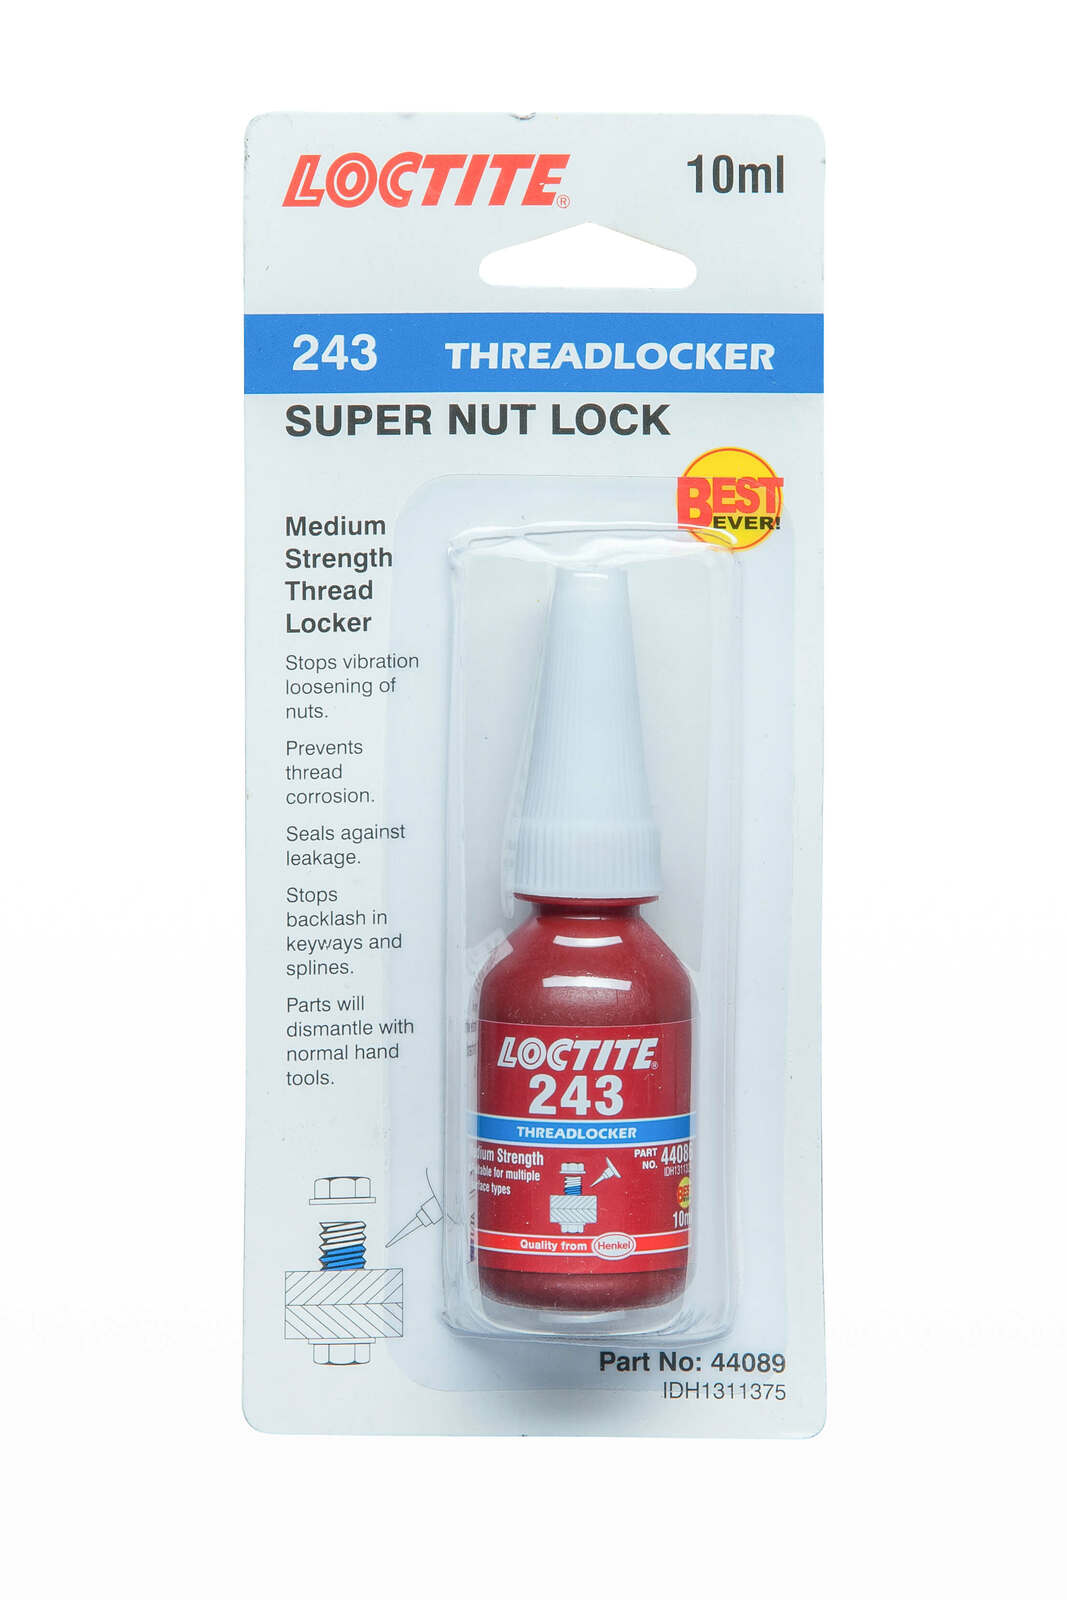

Loctite 243 Medium Strength Threadlocker
Choose your option
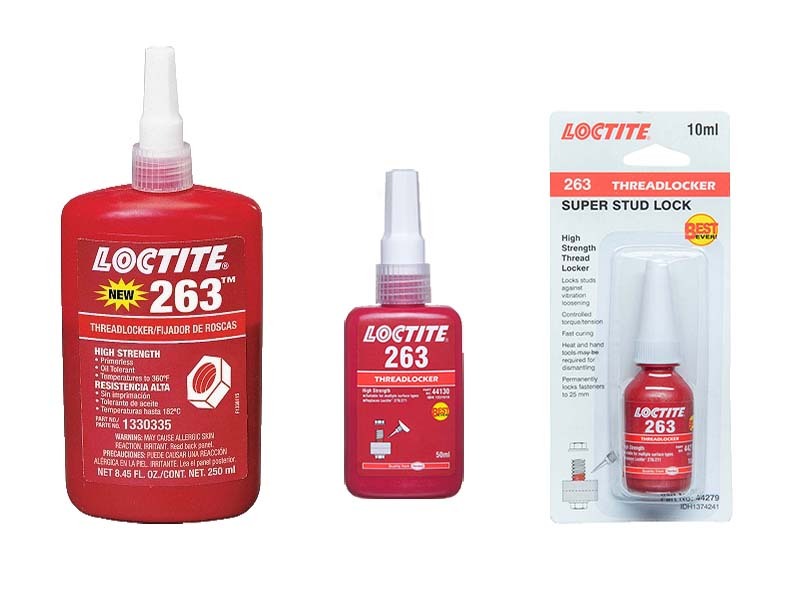
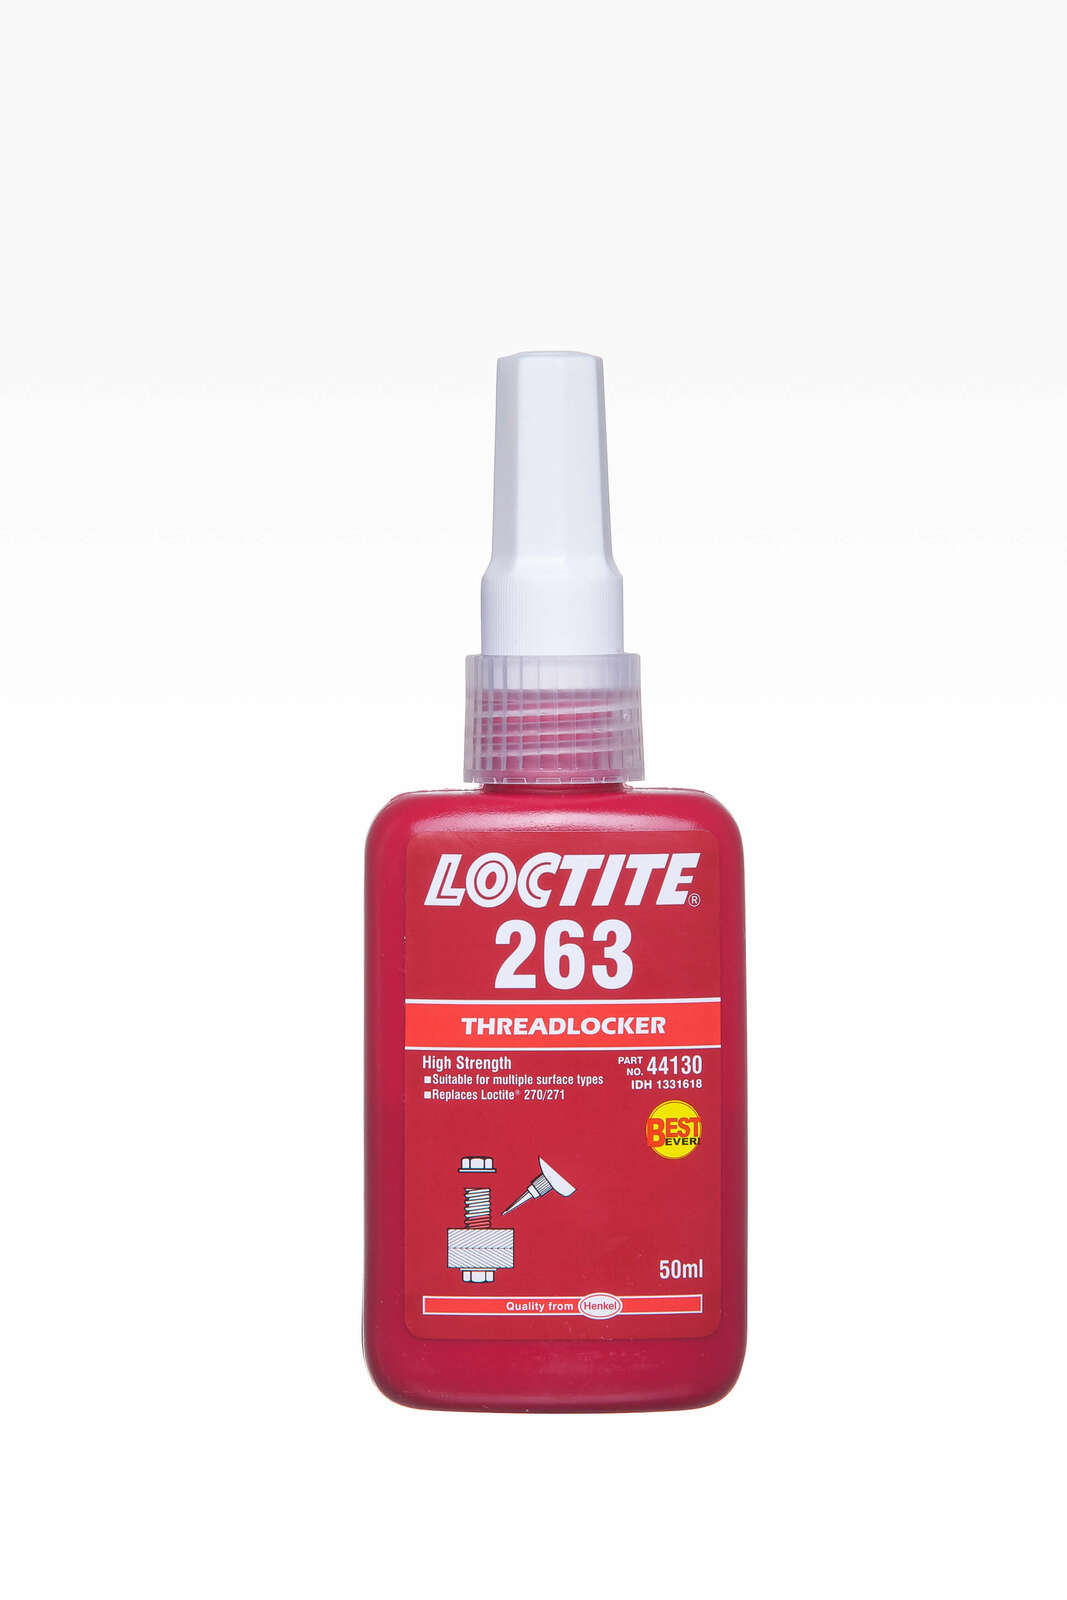
Loctite 263 High Strength Threadlocker
Choose your option

Loctite SF 770 (Heptane) Polyolefin Primer 100ml
Choose your option

Loctite 5331 Plastic Pipe Sealant 100ml
Choose your option


Austlift Flat Web Sling 2Tonne
Choose your option

Austlift Flat Web Sling 1Tonne
Choose your option


Austlift Round Sling 2Tonne
Choose your option


Austlift Soft Eye Axel Strap
Choose your option


Gates G-Force CVT Drive Belt
Choose your option


50 x 915mm Assorted Grit Belt Aluminium Oxide - Pack of 5
Choose your option


Safra Premium Aluminium Alloy TIG Welding Rod 5kg
Choose your option


Austlift 25mm x 1.7m Motor Bike Tie Down With Snap & S Hook (Pair)
Choose your option


Bossweld G Size Cylinder Trolley (Large) With Pump Up Wheels
Choose your option


Bordo 2673-S3 Quad Max 4 Flute Drill Cutter Set 16, 20, 22, 25 & 32mm, 5pcs
Choose your option
Our Customer's Favourite
Buyer's Guide

Father's Day Gift Guide
This guide offers rugged, practical tools and gear from safety boots and welding helmets to hydration solutions and storage upgrades designed to bring comfort, utility, and organization to hardworking dads.

V-Belt Storage & Handling: Extend Belt Life
Protect your belts. Protect your bottom line. Whether you're managing a plant, servicing equipment, or stocking spares, how you store and handle V-belts plays a critical role in system reliability. Many failures start not at the machine—but in the storeroom. Why Keep Spare Belts? Minimizes downtime—avoids waiting days for replacements and loss of productivity. Shelf Life & Ideal Storage Conditions Belts can last up to 6 years if stored below 85 °F (29 °C) with humidity under 70%. Higher temperatures halve shelf life per 15 °F increase. Avoid storage above 115 °F (46 °C) or in humid conditions where mildew may form. Do’s and Dont's Do: Keep belts clean, dust-free, and in their original packaging. Store in a cool, dry environment, humidity ideally between 50–80%. Use boxes, racks, or wide pegs to avoid bending/crimping. Don’t: Lose labels (helps with identification) Store near heat sources, ozone-generating equipment, chemicals, or directly on the floor. Crimp, twist, bend tightly, or tie belts—these actions damage internal cords. Belt-Type Storage Tips V‑belts: Hang on pegs or coil loosely (minimum bend radius); avoid distortion. Synchronous belts: Nest on flat shelves or roll with proper radius. Multi-rib/Joined/Banded belts: Store relaxed—either on saddles or in original nested state. Before Installation: Final Checks Replace entire belt sets (dual/multi-groove) with matching brand & specs. Inspect belts and pulleys for damage, ensure proper alignment & tension. Avoid lubricating belts directly. Quick Reference Table Aspect Key Tip Storage Temperature < 85 °F (29 °C) Relative Humidity < 70% Packaging Original, protective Handling No bending/crimping Storage Method Boxes, wide pegs, shelves Pre-install Inspection Alignment, matching, tension By following these guidelines—maintaining ideal environment, avoiding physical damage, and doing thorough checks—you’ll maximize belt lifespan and reduce costly operational delays.

V-Belt Sourcing: Where to Buy & Why Your Supplier Matters
Choosing the right place to buy your V-belts isn’t just about convenience—it’s about performance, compatibility, and long-term reliability. Here’s what you need to know when sourcing industrial V-belts: Who Sells V-Belts? V-belts are available through various retailers, including: Automotive parts stores Industrial supply shops Mower repair centres Regional hardware stores However, inventory range and product knowledge vary greatly. Most general retailers carry only common sizes and may not stock specialised or OEM-equivalent belts. Where’s the Best Place to Buy an Industrial V-Belt? The best place to buy a V-belt—especially for industrial applications—is from a reputable specialist supplier. That’s where AIMS Industrial comes in. We’re more than just a supplier—we’re your V-belt sourcing partner, offering: One of the widest selections of industrial belts in Australia Smart AI-powered filters to match exact specs or OEM codes Technical support and expert advice from experienced professionals Same-day dispatch and fast delivery options Whether you’re replacing a critical drive belt or planning a full maintenance schedule, AIMS ensures you get the right belt, the first time. Should I Buy From a Local V-Belt Supplier? Buying locally might be a quick fix in emergencies—but for long-term reliability and proper fit, a specialist supplier like AIMS is your best bet. Even if you’re not nearby, our online store and responsive support team make it just as easy to order the correct V-belt, without leaving your workshop.

V-Belt Selection & Application: The Smart Way to Choose the Right Belt
Choosing the right V-belt isn’t just a matter of size—it’s about matching the belt’s design and strength to your machine’s performance requirements, environmental conditions, and application. At AIMS Industrial, we go beyond specs. We help you make confident, informed choices through a mix of expert knowledge, intelligent filtering tools, and AI-backed insights—so you get the right belt the first time. How Do I Choose the Right V-Belt for My Application? Start by evaluating the following: Load – How much power must the belt transfer? Speed – Is your system running at low, moderate, or high speeds? Pulley Size – Smaller pulleys require more flexible belts. Environmental Conditions – Consider heat, humidity, oil exposure, or outdoor elements. Manufacturer Guidelines – Always check technical specs to ensure compatibility. What Factors Affect V-Belt Selection? Several key variables influence which belt is best: Power Rating (kW or HP) Speed (RPM) Pulley Diameter & Centre Distance Operating Temperature Moisture, Dust, Oil, and Outdoor Exposure Shock Loads or Reversing Drives What Is the Maximum Speed for a V-Belt Drive? Classic V-belts can typically run up to 30 m/s (108 km/h), depending on construction and size. Always verify speed ratings in the product’s technical datasheet for safety and efficiency. What Load Can a V-Belt Handle? The load a V-belt can handle varies based on: Cross-section profile (A, B, C, etc.) Belt material and layering Reinforcement cords Heavy-duty industrial V-belts often come banded or cogged for enhanced strength. Always refer to manufacturer data for exact ratings. Can V-Belts Be Used in Reverse Drives? Yes—Double V-belts (hexagonal belts) are specifically designed to transmit power from both sides, making them ideal for: Reversible machinery Multi-pulley systems Agricultural and industrial conveyors Are V-Belts Suitable for High-Temperature Environments? Absolutely—but only certain models: Look for belts marked “heat-resistant” or with EPDM or aramid fiber construction These are designed to withstand 120°C+ operating conditions Can V-Belts Be Used Outdoors? Yes—if they're built for it: Wrapped V-belts with synthetic or treated fabric covers resist UV and moisture Weather-resistant V-belts offer protection from oil, rain, dust, and heat When you shop with AIMS, our filters and product data help you narrow down belts designed for exterior applications. What Is the Minimum Pulley Diameter for a V-Belt? Using a pulley that’s too small can: Reduce belt life Cause slippage or misalignment Increase operating temperature Minimum pulley diameters are defined per belt type and size. For example: A-section: min. 75–100 mm B-section: min. 125–150 mm Always refer to the belt’s datasheet or our team for pulley diameter guidance. Final Thoughts V-belt selection doesn’t have to be overwhelming. With the right understanding of your system’s speed, load, environment, and design specs, and the support of intelligent filters and AI analysis, finding the ideal belt is simple. Ready to spec your next V-belt with confidence? Browse our full range of V-belts here or speak to a product specialist today. Looking for V-belts near you? We’ve got you covered! Whether you need a quick replacement or want to upgrade, local stock of quality V-belts is ready to keep your machines running smooth. At AIMS Industrial, we offer a wide range of V-belts in all major profiles, plus expert advice and fast delivery right to your door. Just tell us what you need, and we’ll help you find the perfect fit! Not all V-belts are built the same. Get the lowdown on types, materials, and what makes each one tick. Up Next: Best Practices on V-Belt Installation & Maintenance